S-Matrix – Software Solution Partner of:

![]()
![]()
Fusion Product Development
Revolutionary QbD Software for R&D!
Works with the following Chromatography Data Software:
- ChemStation and OpenLab 1.x – Agilent LC Systems
- Chromeleon™ 7.2 (SR3 or later) – Dionex™ and Agilent LC Systems
- Empower™ 2 (FR3 or later) and 3 – Waters® and Agilent LC Systems
Fusion Product Development (FPD) is a general Design of Experiments (DOE) module which plugs into the Fusion QbD platform in the same fashion as the Fusion LC Method Development (FMD) and Fusion LC Method Validation (FMV) modules. It connects into the same Fusion Administrator controlled 21 CFR 11 Regulatory Compliance and Workflow Management System feature sets, and has the same internal e-signature and audit trail features.
Key Benefits
- Translates QbD Guidances into Usable Tools
- Designed for Practical Use by Working Scientists and Engineers
- Quantifies and Manages Risk
- Compliant with 21 CFR p11
Example Applications
- Development of Non-LC Analytical Methods (e.g. Dissolution, GC, CE)
- Formulation Studies
- Tableting / Tablet Coating Studies
- Synthetic Chemistry
- Product and Process Development
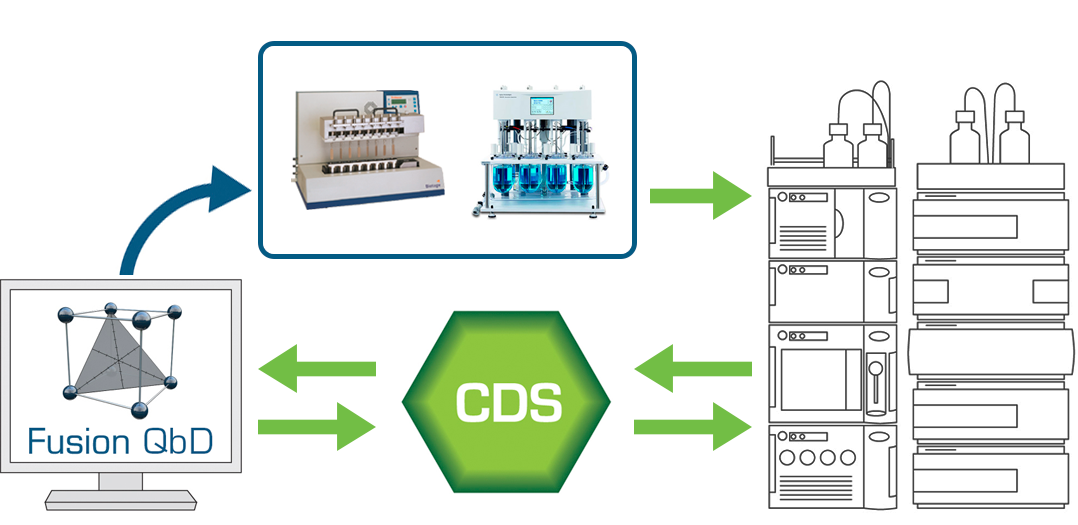
The experiment setup interface is generalized, so the user can create any kind of experiment for any kind and combination of user-defined variables. FPD can also create testing designs associated with the experiment design which can be exported to your Chromatography Data Software (CDS – connectivity includes Agilent ChemStation, Dionex Chromeleon, and Waters Empower 2 and 3) when some of the results testing is to be done on LC or GC, and of course automatically capture the chromatographic results and remap them to the experiment design for data analysis, response graphing, robustness analysis, numerical and graphical optimization, and its advanced QbD-aligned graphical reporting features.
Design of Experiments
In the Automated Design mode, FPD automatically selects the most efficient design for you given your phase of the project (Screening or Optimizing) and the variables you have selected for study. In the User-interactive mode you have full control over the choice of design to use and all associated design structure settings. FPD&s comprehensive library of statistical experimental design types includes Full and Fractional Factorial, Plackett-Burman, Box-Behnken, Central Composite, Star, Mixed Level, and Model-Robust Algorithm (Letter Optimality) designs for Mixtures, Processes, and Combined (mixture and process).
Advanced Response Data Handling Toolsets
- DESCRIPTIVE STATISTICS (Test Repeat Data) — Included with Base Package
- FPD can automatically process results data consisting of multiple repeat measures, creating statistically modelable results from repeat measurement data for the experiment runs, including:
- Mean
- Median
- Mode
- Variance
- Standard Deviation
- % RSD
- Skewness
- Kurtosis
- It can automatically compute the Difference of each statistic listed above from a Standard Result when the standard data are either (1) part of the results (internal standard data), or (2) entered by the user (external standard data).
- It will compute and report all the above values, as well as re-map them to the experiment design for analysis, graphing, robustness analysis, optimization, and reporting.
- FPD can automatically process results data consisting of multiple repeat measures, creating statistically modelable results from repeat measurement data for the experiment runs, including:
- TIME SERIES (e.g. Dissolution, Synthesis) — Additional Toolset Option
- FPD can automatically process time-series based results data, creating graphical data profiles and statistically modelable results for each experiment run, including:
- f1 and f2 curve comparison results and Weibull curve fit metrics for each run.
- extract any number of other meaningful curve-based results for each run, such as “Y-mean at Time X = M1, M2, …”, “Y-S.D. at Time X = N1, N2, …”, and “Time X when Y-mean = O1, O2, …”, where “M, N, and O” are user-settable values.
- It will compute and report all the above values, as well as re-map them to the experiment design for analysis, graphing, robustness analysis, optimization, and reporting.
- FPD can automatically process time-series based results data, creating graphical data profiles and statistically modelable results for each experiment run, including:
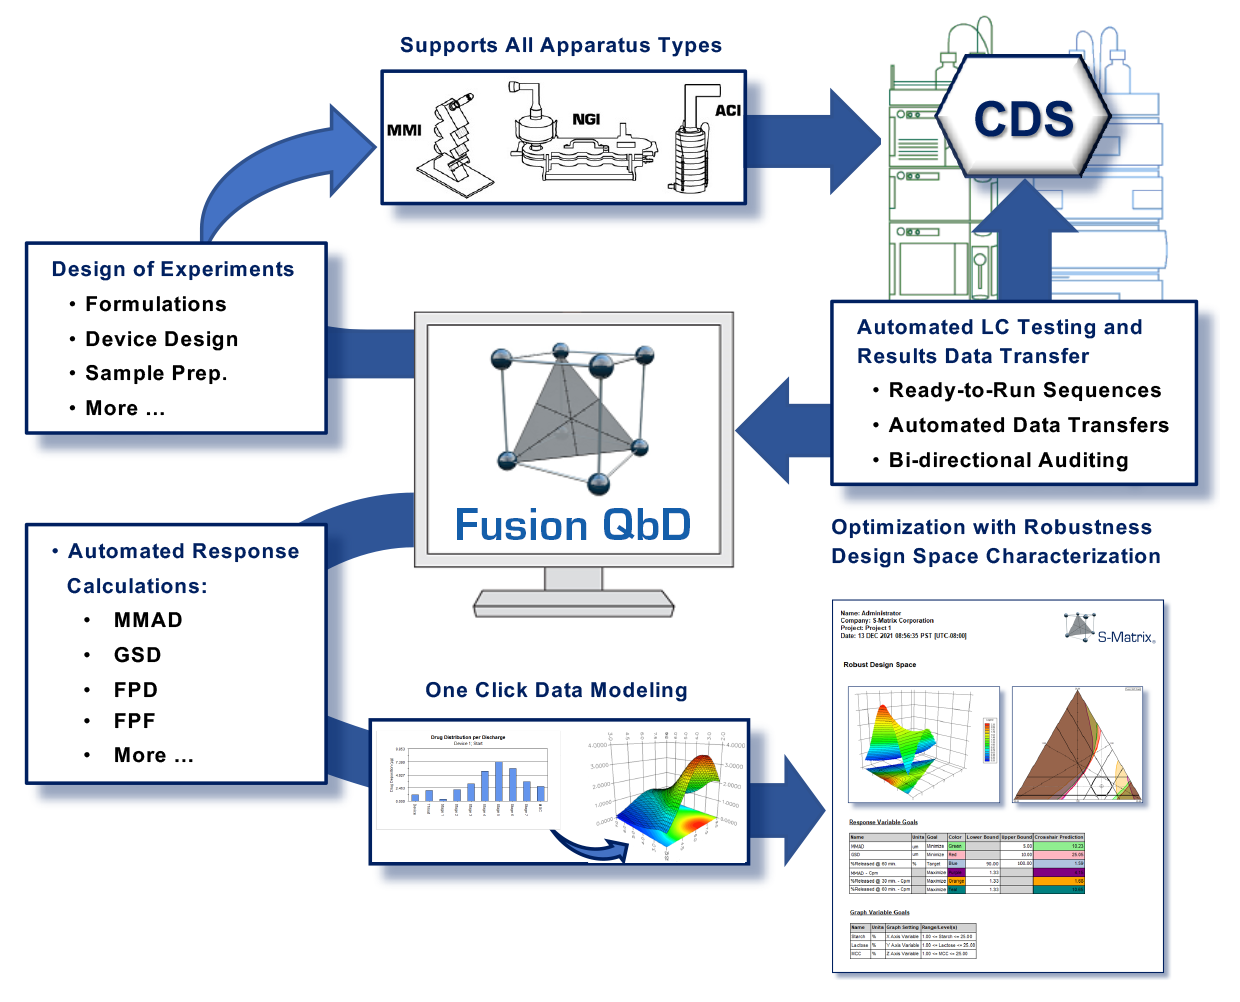
- INHALER TESTING (Respiratory Drug R&D) — Additional Toolset Option
With this toolset you can automatically:- Create Testing Plans for respiratory drug and device testing results data such as are obtained from ACI and NGI cascade impactor testing.
The Inhaler Testing Toolset can automatically create Testing Plans for:- USP Apparatus 1-6 and Ph.Eur. 2.9.18 Apparatus C, D, E.
- any combination of device by stage of dose delivery life
- Exchange LC testing plans and chromatogram results between Fusion QbD and your Chromatography Data Software (CDS) with full Part 11 compliance support, data integrity, and bi-directional auditing.
- Export the Testing Plans to the CDS as ready to run sequences which include your standards injection strategy
- Import all chromatogram results automatically from the CDS with full data tracking and audit logging
- Compute all your critical particle size distribution results from the chromatogram results:
- compute apparatus stage and group averages, Material Balance, Mass Balance, Metered Dose, Emitted Dose, Actuator/Device Retention, Fine Particle Dose (FPD), Fine Particle Fraction (FPF), Mass Median Aerodynamic Diameter (MMAD), and Geometric Standard Deviation (GSD)
- map all computed responses to the experimental design for automated data analysis
- Create Testing Plans for respiratory drug and device testing results data such as are obtained from ACI and NGI cascade impactor testing.
Statistical Data Modeling
FPD has the most advanced and complete automated regression modeling capability available today, with integrated error analysis, outlier analysis, transformation analysis, and stepwise regression with built-in diagnostics. In the Automated mode, FPD automatically generates a statistically defensible model of the correct form and order given the experiment design and results data content. In the User-interactive mode you have full control over the choice of starting-point models, the regression analysis approach, and the associated analytic settings.
Robustness Simulation
FPD brings a full-featured QbD-based methodology to formulation and process development. Regulatory agencies state that a best practices approach should integrate robustness characterization into R&D studies. Therefore, a critical feature of FPD is the patented Robustness Simulator™ technology (U.S. Patent No. 7,606,685 B2), which can automatically compute process robustness indices such as Cp and CpK for all Critical Quality Attributes (CQA) studied using advanced Monte Carlo simulation techniques. This novel methodology automates a best-practices approach in which formulations and processes can be rapidly developed and simultaneously optimized for mean performance and robustness.
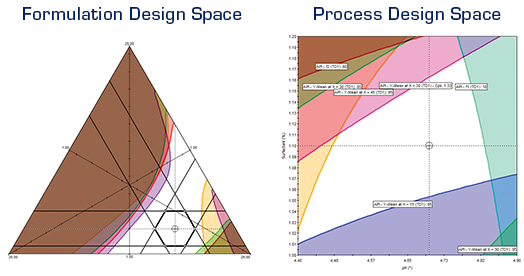
Data Visualization
FPD will generate model-based graphics which visualize the relationships between your study variables and your critical performance characteristics (responses). These are displayed as readily interpretable Response Surfaces, contour plots and effects plots ensuring you acquire "process understanding". Instant graphics includes 4-factor trellis graphics — a series of response surface or contour graphs of two graphed variables at user-defined low, medium, and high levels of a 3rd and 4th study variable.
Optimization
FPD’s powerful optimization tools allow you to search for the conditions that provide the required Critical Quality Attribute goals. Results are produced and displayed in concise tabular and graphical report formats. The Numerical Optimizer reports the search results for each included response (CQA), along with the prediction confidence interval limits, and the "Overall Desirability" of the results relative to your defined performance goals. The Graphical Optimizer translates the modeled experiment results into a visual display of the overlapping study variable conditions in which all response (CQA) quality and performance goals are simultaneously met.
Links to More Information about Fusion Product Development!
- Product Brochure (PDF | Online)
- Application Notes